Technicians and operators every so often notice unusual vibrations or noises on the plant or shop floor where they work daily. In order to determine if a serious problem actually exists, they could proceed with a vibration analysis. Vibration analysis implies, state of a machine is identified on the basis of an analysis and study of vibration.
Successful application of vibration diagnosis requires in practice staff with considerable degree of knowledge and experience. Standard work of data gathering may be performed by skilled personnel without academic educations, but data assessment and processing of the machine condition is the task for an engineer who has expertise in different areas like mathematics, design of machines, dynamics, signal processing etc. and who is capable to use this expertise in context.
Why is Vibration Study and Analysis Important?
The vibration analysis is a very important technique, in terms of mechanical vibrations for machine diagnosis. It is based on the high information content provided by the machine vibration signals that are an indicator of machine condition, used for the diagnosis of faults. Vibration analysis in a predictive maintenance program, is widely used for monitoring and detection of initial and critical faults in machinery parts, like shafts, bearings, rotors, couplings, motors etc. Some problems that are usually detected by vibration analysis are: unbalance, misalignment, bent shaft, rolling bearing faults, eccentricity, resonance, looseness, rotor rub, fluid-film bearing instabilities, gear faults, belt/sheave problems.
Following are the reasons that makes vibration study and analysis important:
- Reduces equipment costs:
- Reduces labor costs
- Reduces lost production time
- Increases safety
- Increases revenue
- Increases efficiency of employee time
What is Done During Vibration Study and Analysis?
The main objectives when performing a vibration study typically fall into one or more of three categories:
- Capacity: Map the dynamic behavior of the machine from current to targeted speeds, yielding the most cost-effective approach by foreseeing problems.
- Rebuild: Evaluate how rebuilds will affect the dynamic behavior of the machine and its consequences at current or increased speeds.
- Troubleshooting: Locate and eliminate vibration sources currently having a detrimental effect on the machinery or process.
Vibration analysis is performed by Fourier transform (by its decomposition into Fourier series). All actions related to the study and analysis, given below are employed in analyzers that are utilised in vibration diagnostics.
There are different types of analyzers: operational or laboratory, with one or more channels – but the principle of their operation is always the same.
Fourier Transform
Periodical in time T, function x(t), can be stated as an infinite or endless progression:

This expression means that the original function x(t) can be composed from (infinite) number of sinusoids of different amplitudes, frequencies of which are multiplies of the fundamental frequency ω.
Coefficients an and bn are Fourier or spectral coefficients of the function x(t) and can be computed using expressions:

Discrete function x (t), which is defined on the set of N different instants of time tk (k = 1, N), can be written as a finite Fourier series:

Fourier coefficients are usually depicted in the form of amplitude cn and phase φn:

Then, the finite Fourier series can be written as:

This form of Fourier transform is called the discrete Fourier transform (DFT). The resulting Fourier series, a set of sinusoids from which the original waveform can be composed, is called a frequency spectrum.
There is a basic relationship between the length of the sample T, the number of discrete values N, sampling (or capture) frequency fs, frequency range and spectral (or frequency) resolution. Spectrum frequency range is 0−fmax, where fmax is the Nyquist frequency and ∆f is the frequency resolution (spacing between frequency lines).
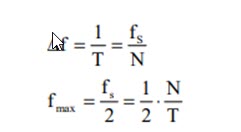
An algorithm called Fast Fourier Transform (FFT) is used in up to date analyzers, where N is an integer power of number 2. In fact, the upper frequency spectral limit fmax is even more reduced in comparison with the theoretical value (e.g. for N=211=2048, only 800 frequency lines are used rather than 1024), which will be explained in the following chapter.
How is Vibration Study and Analysis Performed?
Raw time Waveform Analysis
Vibration study and analysis personnel will utilize the magnitude various signals to find out the source and nature of a problem. The most common measurement is that of vibration – in units of acceleration, velocity or displacement. Study and analysis of the raw time waveform gives helpful data for troubleshooting many issues, involving those with gearboxes. Impulsive vibration is better analyzed in the time domain.
Spectrum Analysis
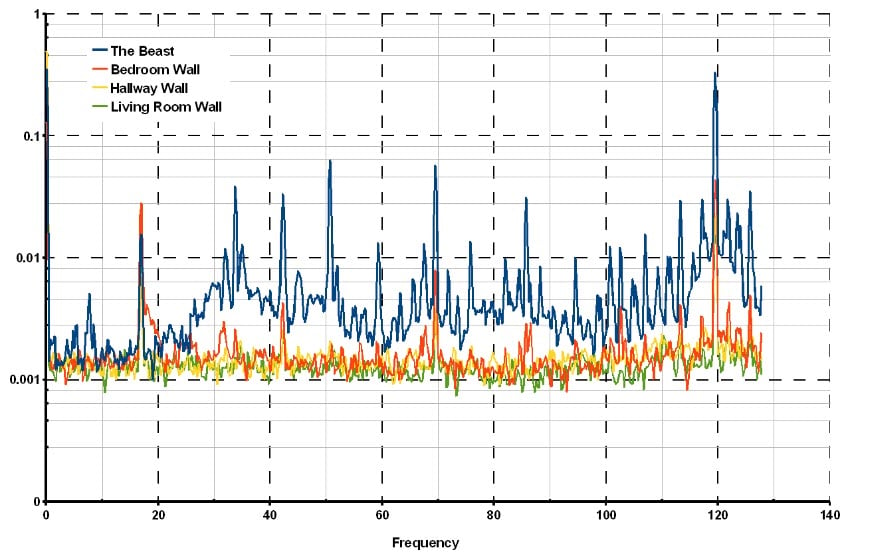
This divides the total vibration into separate frequencies so that the source of a given glitch can be easily recognized. This includes handing out the raw time domain data through a mathematical computation called the Fast Fourier Transform or FFT. The FFT algorithm converts the original signal from the time domain into the frequency domain. The outcome is that a complex signal is divided into various contributing frequencies.
Speed Trials
Variations in vibration levels as a function of varying machine loads or speeds are usually studied with the help of waterfall plots. Waterfalls, also referred to as cascade plots or spectral maps, consist of a series of spectrums placed one behind the other to generate a 3-dimensional graph. Thee Y-axis denotes vibration amplitude, the X-axis denotes Frequency and the Z-axis represents machine speed or time. Waterfalls are helpful for the determination of resonances.
Impact Testing
Aim of impact testing is to recognize the natural frequencies of usually smaller components in the machine, such as doctors, tube rolls, drive shafts, showers, uhle boxes, etc. This accompaniment the speed trial as the speed trial and resulting waterfalls will denote multiple agitated natural frequencies. The following challenge for the analyst is to find out which module was really resonating as the waterfall depicts them all.
Synchronous Averaging
Synchronous averaging is utilised to separate the influence of vibration of a single rotating source. This is performed by acquiring a tachometer trigger from a prearranged felt or roll and then matching the data acquisition time absolutely with the occurrence of the trigger. When barring is a long-term problem, the system and history need to be reviewed from problem inception through to present day symptoms.
Operating Deflection Shape (ODS) Analysis
Operating deflection shape analysis depicts how a machine shifts in actual operation at particular frequencies of interest and assists find out the reason of the motion. Frequencies utilised in the study and analysis are usually multiples of running speed of the various rolls in the system. If the data used in the ODS analysis is fit to natural frequencies of the system (identified in speed trials, etc.) then the resultant model will show mode shapes instead. Understanding which modes are being agitated and the positions of largest movement allow for the most effective structural modifications.
Finite Element Analysis
Finite Element Analysis (FEA) involves the mathematical modeling of a physical system to predict the structural behavior of the system – involving geometry, material properties, boundary conditions, etc. The model is used to determine what the new natural frequencies of the system will be after structural modification is applied. The model can be as simple or extensive as required.
Following are the Different Data Acquisition Techniques:
Online Data Acquisition and Analysis
Critical machines are almost always provided with continuous online monitoring systems. In here sensors are fit permanently on the machines at suitable positions and linked to the online data acquisition equipment. The vibration data are taken involuntarily for each position and the analysis can be showed on local monitoring equipment or can be moved to a host computer installed with database management software.
This capability allows early identification of errors and provides protective action on critical machinery. Protective action performed by online data acquisition and analysis equipment is in form of generating alarms to caution the operators of an abnormal situation. In the case of critical error, this protective action can turn off machines involuntarily to prevent catastrophic failures. Moving the data to a host computer with database management software improves the suitability and the power of online data acquisition.
Advantages
- Performs continuous, online monitoring of critical machinery.
- Values are taken involuntarily with no human interference.
- Provides almost instantaneous detection of defects.
Disadvantages
- Reliability of online systems must be at the same level as the machines they monitor.
- Failure can prove to be very expensive.
- Installation and analysis require special skills.
- These are expensive systems.
Portable Data Collectors/Analyzers
Modern data analyzers give data of any vibration characteristics in any chosen engineering facility or unit. There are basically two types of data collectors and analyzers, Single channel and Dual channel.
Advantages
- Can record, collect and display vibration information like a FFT spectra, time domain waveforms and overall trend plots.
- Provides orderly collection of data.
- Automatically reports measurements out of pre-established limit thresholds.
- Can perform field vibration analysis.
Disadvantages
- They are relatively expensive.
- Operator must be trained for use.
- Restricted memory ability therefore information must be downloaded subsequently to collection.
Handheld Vibration Meter
A handheld vibration meter is an inexpensive and simple-to-use instrument that is an essential part of any vibration program. Vibration technicians and plant operators carry handheld analyzers and meters on their periodical rounds. They provide a display of vibration levels, when these are held in contact with machinery. The readout provides immediate information that can be used to determine if the overall vibration levels are normal or abnormal. These meters are generally battery powered and utilise an accelerometer for sensing.
Advantages
- They are convenient and flexible and require very little skill to use.
- It is an inexpensive starting point for any new condition-monitoring program.
Disadvantages
- Limited in the type of measurements that they can perform.
- No data storage capability.
Benefits of Vibration Study and Analysis
- Determination of the dynamic behavior of machine sections
- Determination of the mechanical condition of the machine
- Determination of the feasibility of a possible capacity increase
- Most cost-effective implementation of rebuilds
- Forecast future mechanical issues and reduce unintended shutdowns
- By repositioning old rolls to where they can still be utilised, we can save on roll remakes.
- Solutions to problems such as barring and gear train failures

