The mid 1960’s marked the beginning of the field of frequency stability analysis. Frequency instability is caused by problems, like poor coordination of operation control, protection devices, weakness of equipment response and deficiency in generation reverse. Because of the non-linear behaviour of electrical power system, the categorising has become crucial for electrical power system stability troubles. In order to understand the instability problems and develop solutions regarding the physical nature of the instability, the size of disturbance anime frame are necessary to be deliberately estimated.
Why is Frequency Stability Analysis Necessary?
The aim of a frequency stability study is to portray the frequency and phase flickering of a frequency source in the frequency and time domains. Frequency stability is a crucial consideration in power system operation and planning, particularly as a consequence of recent increase in load demand. Consideration of load–generation balance so as to avoid system from splitting into islands has become a necessity in power system. It can be realized, whether system is stable from frequency viewpoint or not. Now threshold of under frequency load shedding protective device can be determined effectively. Frequency stability is crucial in isolated island grids when these small systems are open to different range of interruptions, like loss of generation or loads.
What is Done During Frequency Stability Analysis?
IEEE Standard Definitions of Physical Quantities for Fundamental Frequency and Time Metrology- IEEE Standard 1139-1999, is the standard used for frequency stability analysis.
A frequency stability study is usually done on a single device, and not on a group similar devices. The output of the device is generally assumed to exist indefinitely before and after the particular data set was measured, which are the (finite) population under analysis. It is also generally assumed that the stochastic characteristics of the device are constant (both stationary over time and ergodic over their population).
The analysis may show that this is not true, in which case the data record may have to be partitioned to obtain meaningful results. It is often best to portray and eliminate deterministic factors like frequency drift and temperature sensitivity, before analysing the noise. Environmental effects are often best handled by eliminating them from the test conditions. It is also presumed that instrumental effects and the frequency reference instability are either insignificant or eliminated from the data. A usual crisis for time domain frequency stability study is to create outputs at the lengthiest probable averaging times so as to reduce test time and expense. Analysis time is generally not as much of a factor.
How is Frequency Stability Analysis Performed?
The frequency stability analysis procedure is as follows
Data Precision
There are relatively few numerical precision issues relating to the analysis of frequency stability data. One exception, however, is phase data for a highly stable frequency source having a relatively large frequency offset. The raw phase data will be essentially a straight line representing the frequency offset, and the instability information is contained in the small deviations from the line. A large number of digits must be used unless the frequency offset is removed by subtracting a linear term from the raw phase data. Similar considerations apply to the quadratic phase term (linear frequency drift).
Pre-processing
Pre-processing of the measurement data is often necessary before the actual analysis is performed, which may require data averaging, or removal of outliers, frequency offset, and drift. By reducing a line determined by the mean of the first differences, frequency offset may be removed from phase data. A counterbalance may be eliminated from frequency data by stabilising it to have an average value of 0. By subtracting the average of the second differences, frequency drift may be removed from phase dataflow.
Gaps, Jumps, and Outliers
Usually the reason for the gap or outlier is known, and it is particularly important to explain all phase discontinuities. Plotting the data will often show the bad points, which may have to be removed before doing an analysis to obtain meaningful results. Frequency outliers are found by comparing each data point with the median value of the data set plus or minus some multiple of the absolute median deviation. Their occurrence indicates that the statistics are not stationary, and it may be necessary to divide the data into portions and analyse them separately.
Gap Handling
In order to keep up the correct implied time period between measurements, gaps must be considered, and a value of zero is mostly assigned to represent a gap. Numerous analysis functions can create significant outputs for data with gaps just by avoiding those points that has a gap. Gaps may be filled in phase or frequency data by replacing them with interpolated values, by first removing any leading and trailing gaps, and then utilising 2 amounts just after and before any inside gaps to find out linearly interposed values inside the gap.
Uneven Spacing
By utilising individual time tag spacing, randomly spaced phase data with associated time tag can be handled, when converting it to frequency data. If the tau differences are small, the average time tag spacing may be used to analyse the data, and there by positioning the frequency data on an average uniform grid.
Analysis of Data with Gaps
When studying the steadiness of data with gaps or missing points, care must be taken. Missing points can be found by examining the time tags associated with the data, and gaps can then be inserted as placeholders to maintain equally spaced data. Likewise, for the same reason outliers can be also be substituted with gaps for the same reason. These gaps can span multiple points.
Phase-Frequency Conversions
Phase to frequency conversion is straightforward for data having gaps. Due to the necessity to integrate the frequency data, conversion from frequency to phase is more troublesome. The average frequency value, which may cause a discontinuity in the phase record, is utilised to measure the phase during the gap,.
Drift Analysis
For data with gaps, this functions performs well, given that absent data are denoted by gaps to keep up a steady time sequence.
Variance Analysis
This function may have the facility to handle gaps. Some of these functions yield satisfactory results in all cases, while others have speed limitations, or provide unsatisfactory results for data having large gaps.
Variance analysis applied to data having large gaps consists of two general rules. They are:
- Use unconverted phase data
- Check the results against the normal Allan deviation (which has the simplest, fastest gap handling ability).
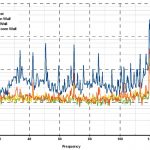
Spectral Analysis
Gap filling in spectral analysis functions can affect the low frequency portion of the spectrum.
Outlier Recognition
While the definition of an outlier is somewhat a matter of judgement, it is important to find and remove such points in order to use the rest of the data, based on their deviation from the median of the data, using a deviation limit in terms of the median absolute deviation. This is a robust way to determine an outlier, which is then replaced by a gap. An automatic outlier removal algorithm can iteratively apply this method to remove all outliers, which should be an adjunct to, and not a substitute for, visual inspection of the data.
To find out whether the outliers are because of the measurement process or the device under test, it is crucial to clarify all outliers.