When any electrical system becomes unsuccessful in meeting its objective, the facility should undergo checking to examine the fault, find the root, and perform remedial steps. The aim of electrical distribution system is to sustain correct functioning of the loads. The quality of electric circuit it’s the main cause or improper functioning of the load. In case it is used for troubleshooting or to get marginal data, calculating/studying electrical system components is known as power quality analysis.
Why is Power Quality Analysis Done?
Power quality is one of the major critical topics in industrial facilities as well as one of the major untapped zone of expense reduction and economic gain in today’s businesses. Improper wiring, incorrect grounding, unbalanced loads or improperly protected equipment most likely will send electrical noise through the system and can compromise power quality. The rising necessities on guidance, monitoring, and functioning in current power systems has made power quality monitoring a familiar exercise for facilities.
Aim of Power Quality Analysis
- The analysis of inconsistencies between load and the system
- The assessment of the electric environment at a part of the facility in order to improve modelling methods or to build up a power quality reference
- The forecast of future functioning of load equipment or power quality diminishing equipment
- Improve Power Factor & system efficiency
- Avoid Break-downs & production Interruptions
- Avoid excess Energy consumption
- Remove Harmonics, Surges & Transients from electrical Network
- Avoid Voltage/frequency fluctuations & PLC Hang-up
- Avoid Transformer overheat, Capacitor burst, Trip Etc.
- Savings in Energy Bills due to reduced Losses & KVA demands
- Increased Production Quality as a result of decreased interruption
- Enhanced Life cycle of Electrical network & component
- Maximize Plant distribution Capacity
What is Done During Power Quality Analysis?
Signs of poor power quality are:
- Motor Burnout and Downtime
- Controls/Displays, Memory Loss and Downtime
- Power Factor Problems and High Utility Penalties
- Transformers Failing and Downtime
Each of these problems are caused by different factors. Shared infrastructure is one of the causes. Higher the state of the error, the larger the people affected, or a setback on one customer’s facility may result in a temporary influence on customers on the same subsystem. Other glitches, like harmonics, rises within customer’s system and might spread onto the network and thus affects other customers. Harmonic faults can be handled by a mashup of proper design practice and verified tools.
Following parameters are what describes the quality of power:
Data Collection and Power System Measurements
These values are taken at different locations all through the property to allow precise modelling of harmonic sources.
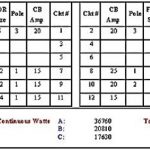
Following measurements are taken:
- System Voltage RMS
- System Current RMS
- Active & Reactive Power
- Power Factor (Instantaneous)
- Data collection from site
- Harmonic measurements along with specific harmonic filtering at normal operating conditions
- Voltage Improvement & stability study
- Three phase balancing study
- Surge & Transient Protection, study
- KVA Capacity Release
- Broadband Harmonic reduction requirement if any
Harmonic Analysis
This includes the usage of computer programs to recognise and forecast possible harmonic problems and reduction methods.
Surges & Transient Analysis
This analysis will record the transient and surges.
Voltage Dips Swells Analysis
This analysis will record the small term fall & rise along with value and route.
Reactive Power Analysis
This analysis will calculate the preferred reactive power at distribution &load end.
Captive Power Analysis
This analysis will calculate and synchronise the captive power so as to cater to demands and decrease utility surcharge and fuel consumption.
Load Flow Analysis
This analysis predicts power flow magnitudes, power factor, voltage levels, and losses in branches of the system based on the specified operating conditions.
How is Power Quality Analysis Done?
IEEE Power Quality Standards and NFPA 70B are outstanding assets to assist identify power quality terms, errors, and remedial actions. The equipment utilised to obtain actual readings and also gather information for downloading to computers for study and analysis is called Power Quality Analysers. Though some are permanently installed in the distribution system, handheld analysers are also used for numerous applications, mainly troubleshooting.
Always follow manufacturer guidelines for setting up the analyser or else following faults may occur:
- Failure to observe current polarity.
- Not matching current/voltage probes.
- Relying on battery power to complete a lengthy monitoring session.
Steps in Power Quality Analysis are:
- The aim of the survey is noted down that will be utilised al through the survey
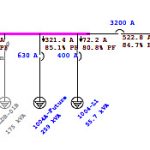
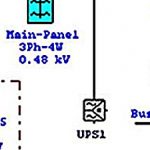
- Proceed with a correct one-line diagram of the electric system of the site.
- Analyser is connected carefully at a particular location in the distribution system end of the main breaker that will regulate incident energy levels to satisfactory range. (Measuring close to the service usually means huge amounts of fault current).
- Continue to “drill down” into the distribution system following the one-line diagram.
- Obtain data at the source of each distinctly derived system.
- Digital cameras work well for quickly capturing nameplate data and later identifying exact connection locations. Print out digital pictures, and maintain all data for the survey. These will become valuable when studying data and conducting further analysis.
- Suspect harmonics If any of the following occurs:
- Overheating of neutrals
- Overheating of transformers or motors
- Nuisance tripping of circuit breakers
- Blown fuses
- Unusual audible noise in larger distribution equipment
- If distorted voltage sine waves are found
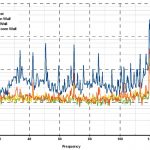
- The magnitude of the various harmonic frequencies and the amount of total harmonic distortion created by the harmonics are the critical factors to determine the severity and correction techniques for any harmonic problem.
- Unusual insulation failures occur, record data for extended periods at the equipment. The most severe transients are often caused by nearby lightning strikes. They can also be the result of switching of loads.
- Voltage sags and swells are the most common type of power quality culprits. Watch voltage readings for drop and rise, and try to relate these deviations to differences in plant conditions or operations.
- Unbalance is often the result of single-phase loads cycling off and on, so monitor for unbalance at panelboards and switchboards throughout a typical plant cycle.
Benefits of Power Quality Analysis
- Assist in preventative and predictive maintenance
- Identify source and frequency of events
- Develop maintenance schedules
- Monitor and trend conditions
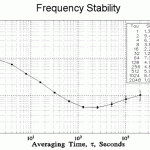
- Analyse and study Flicker, harmonics, voltage variations, transient frequency variation etc.
- Ensure equipment performance
- Assess sensitivity of process equipment to disturbances
- Evaluate performance against specifications

