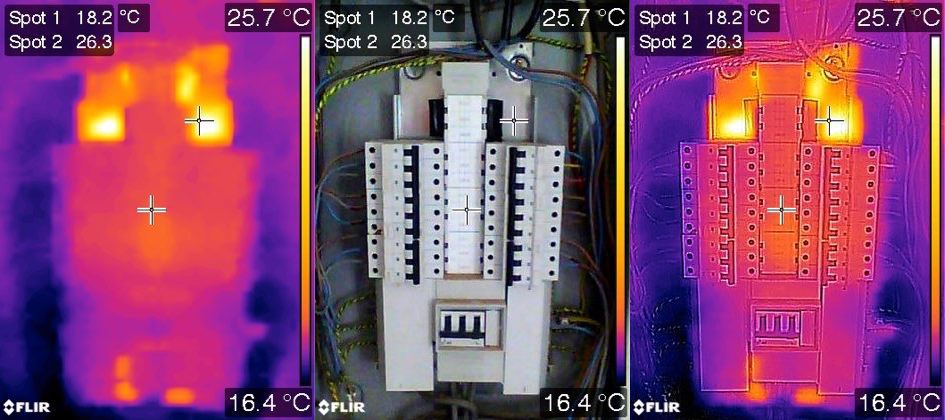
The same image of a 3-phase distribution board from the C2 rendered as thermographic, visible light and Thermal MSX® (with additional spot temperature added in FLIR Tools). Thermal MSX® mode enhances ease of interpretation. Note that the “hottest” part of the image is in fact the board’s rear plate where no electrical activity is present; this is most likely to be reflected heat from elsewhere and illustrates one pitfall in interpreting raw thermographic data.
